Utah new construction market intelligence
The entire Utah new construction market solved
Every builder, every community, every incentive. Tracked daily.
Free during early access.
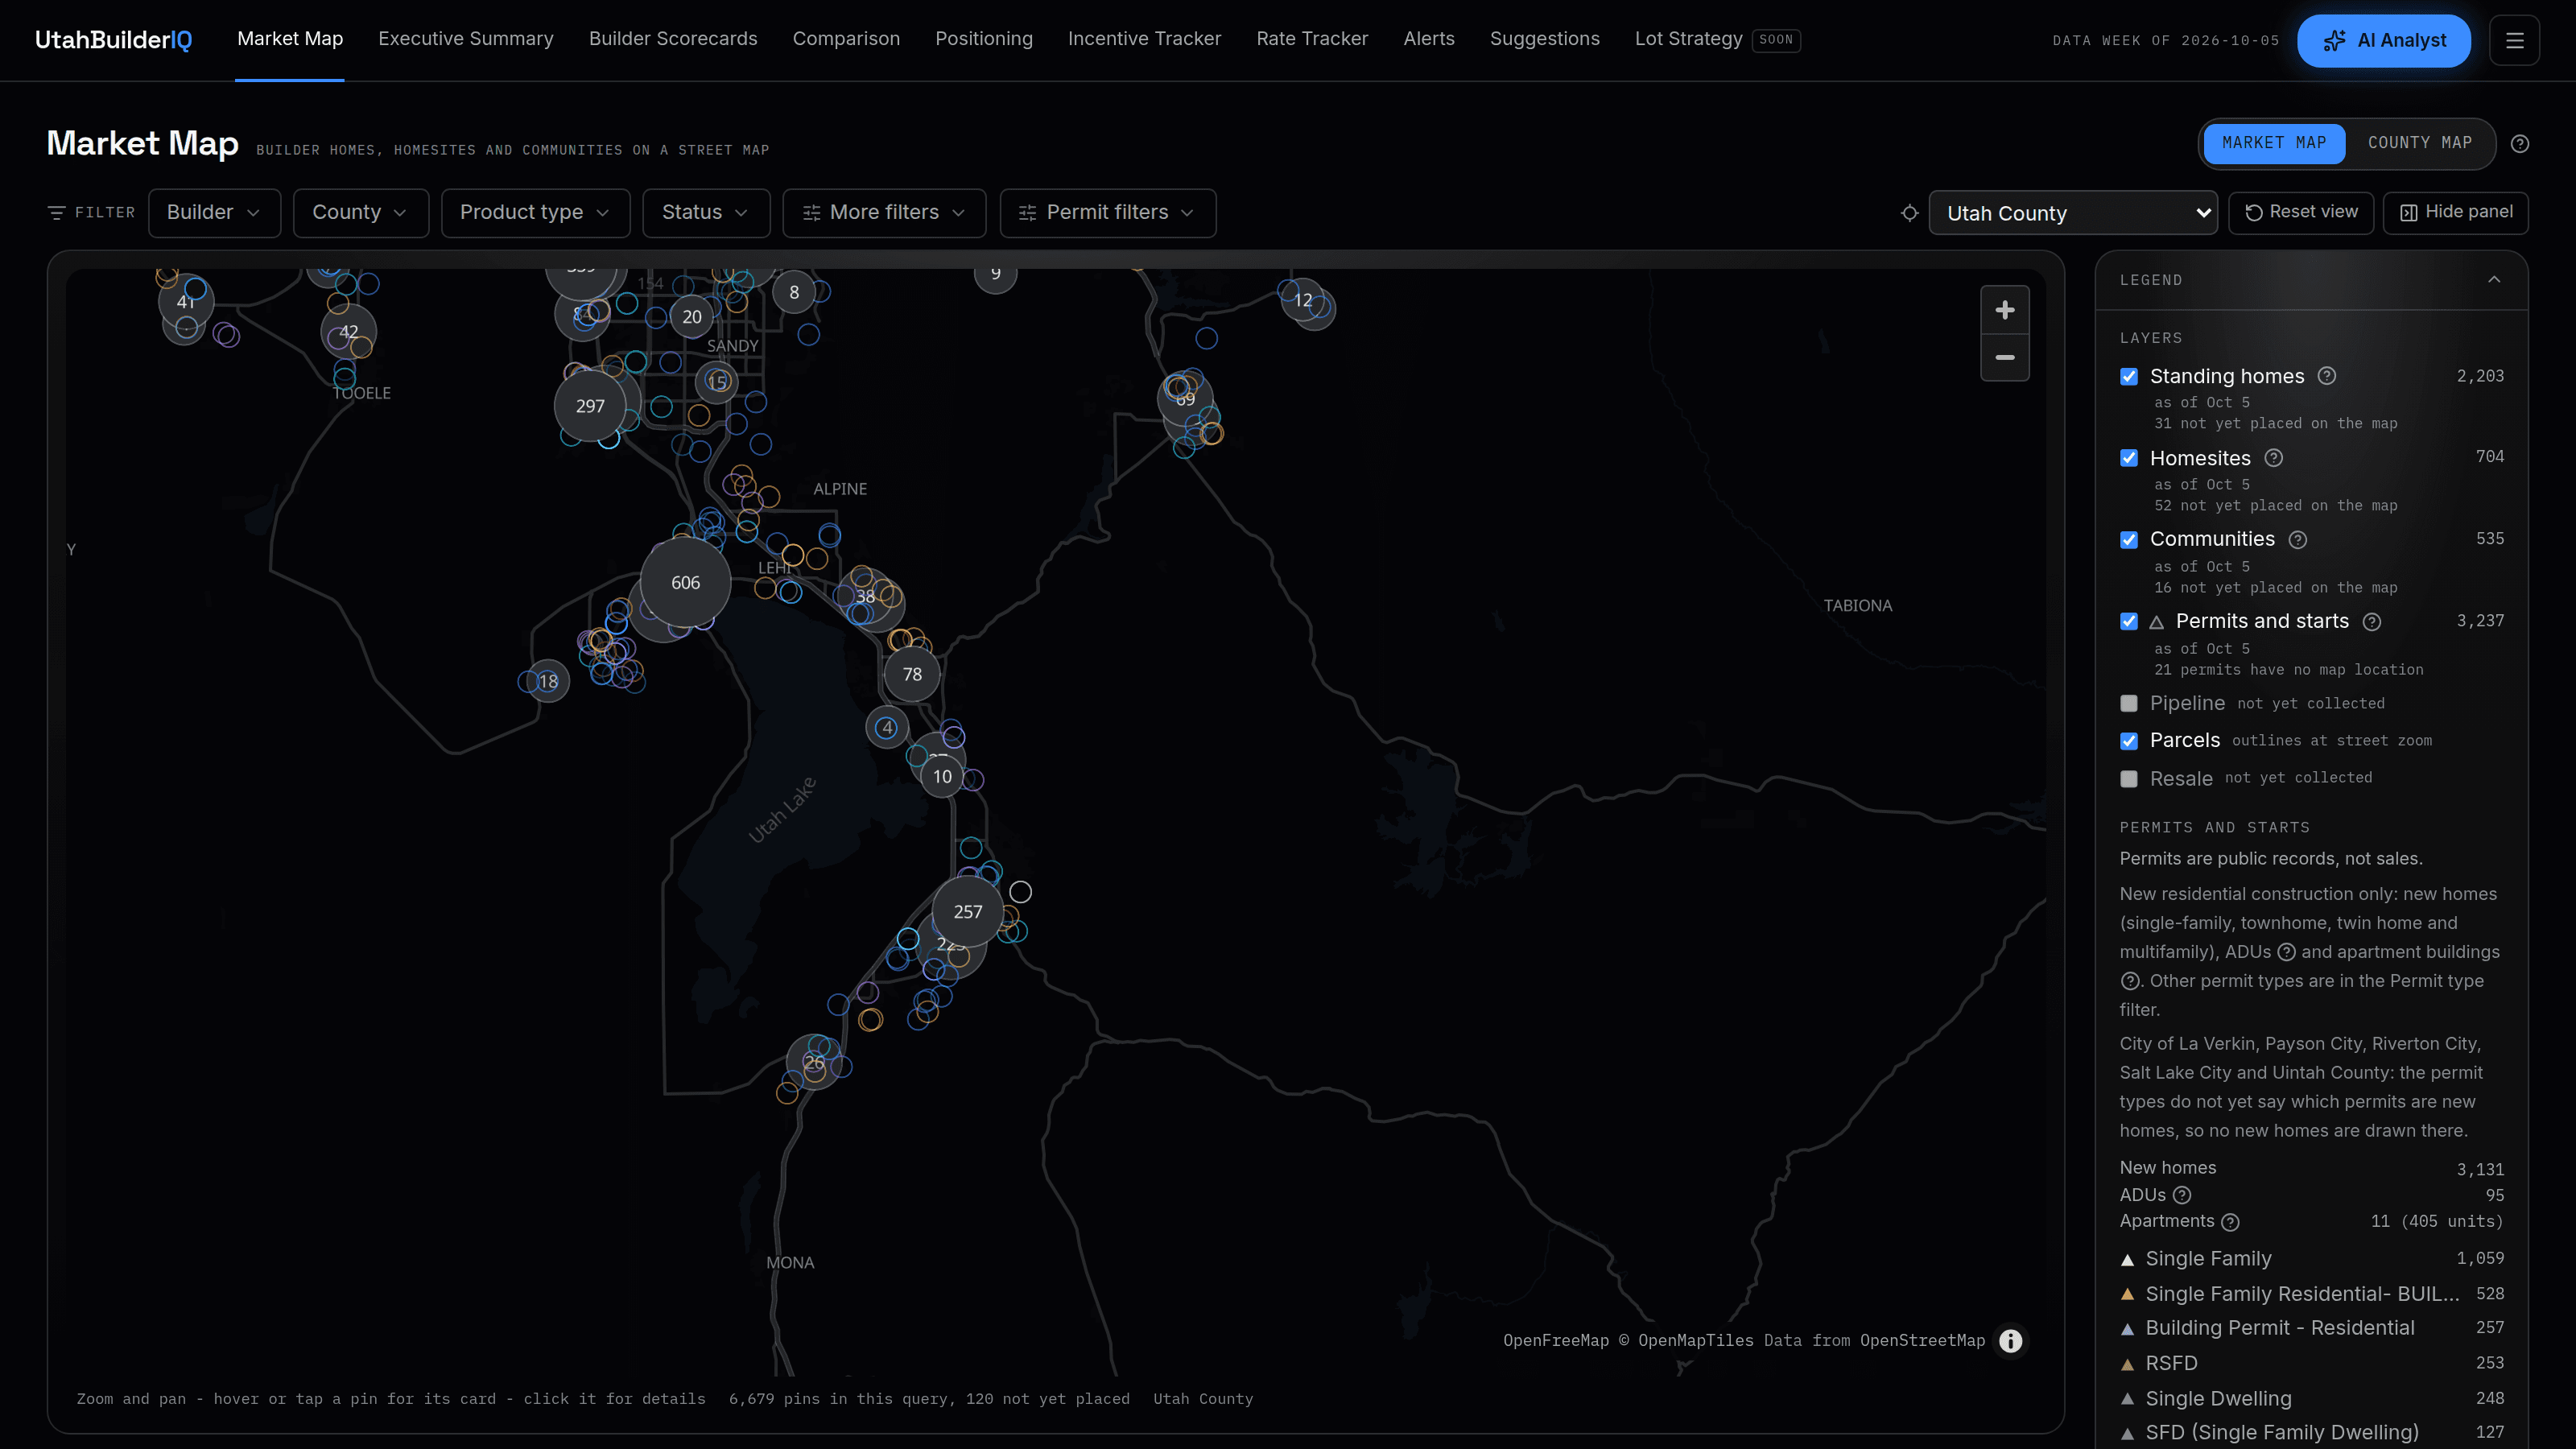
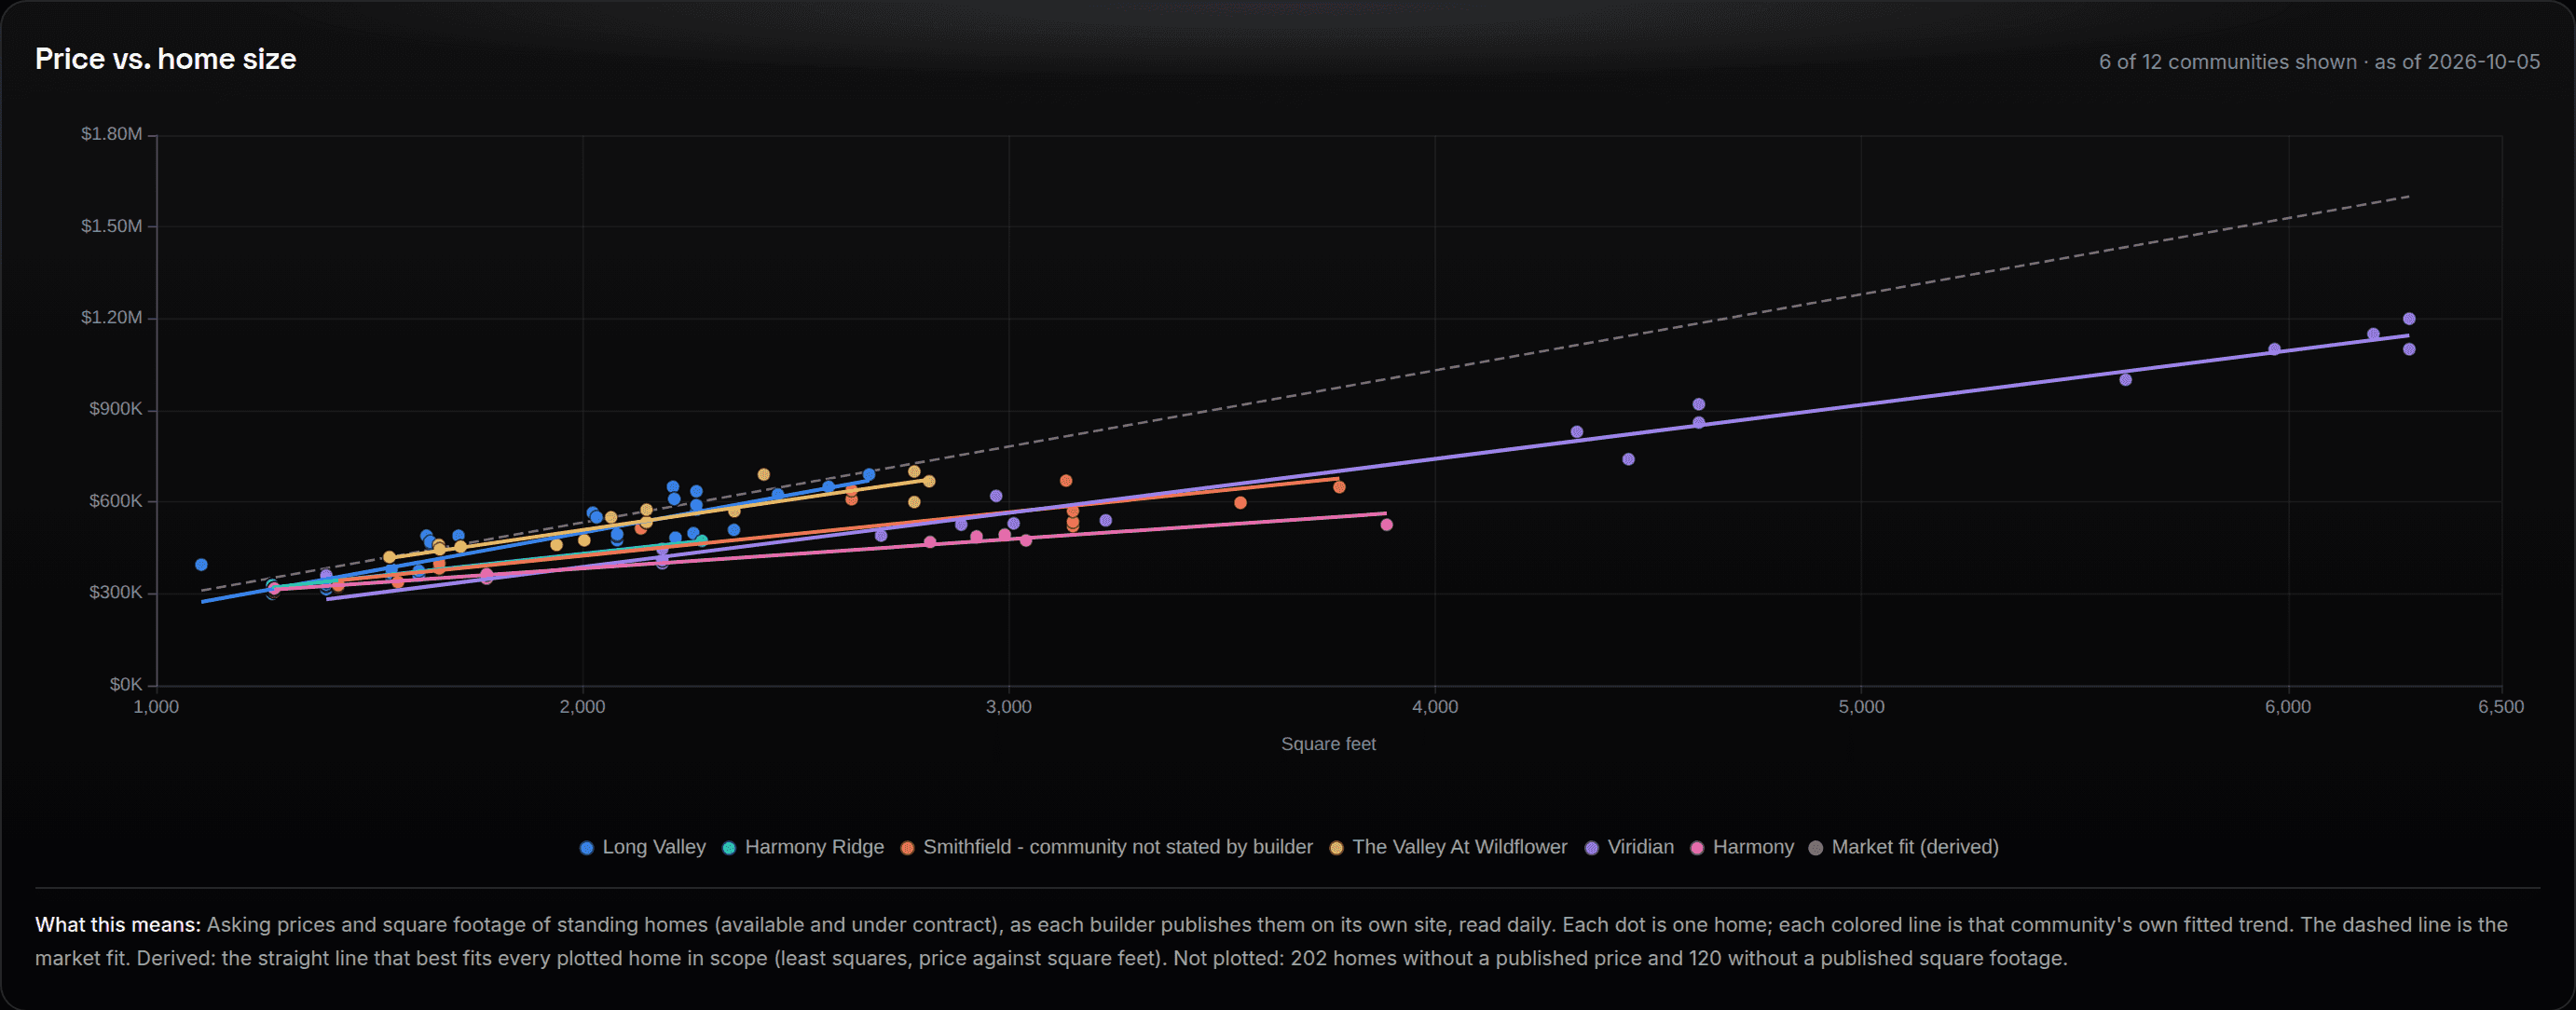
The Market Map and Competitive Positioning, captured from the live product on October 5, 2026.
- 71
- Builders tracked
- 537
- Communities
- 2,234
- Homes priced daily
- 388
- Active incentive offers
The whole market
Every builder. Every community. Every incentive.
How we define market coverage
If a Utah production builder lists a priced home, it is in here, reconciled to that builder’s live site every day. Not a sample. Not a monthly survey. The market, as it stands this morning.
Every builder, reconciled daily
Every production builder’s live site is read and reconciled each day, with per-home deep links back to the source.
The fullest incentive layer
Rate buydowns, price cuts, and closing-cost offers captured across the market, the layer most sources leave out.
Numbers that reconcile
Every figure ties back to a builder’s live listing, with a nightly count reconciliation. No estimates, no guesswork.
Features
Everything you need to read the market
Feature 5 of 8: County Map. The whole state on one map. Shade by inventory, absorption, or pressure. Switch views with one toggle. Drill into any county.
Inside the platform
One live dashboard for the whole market
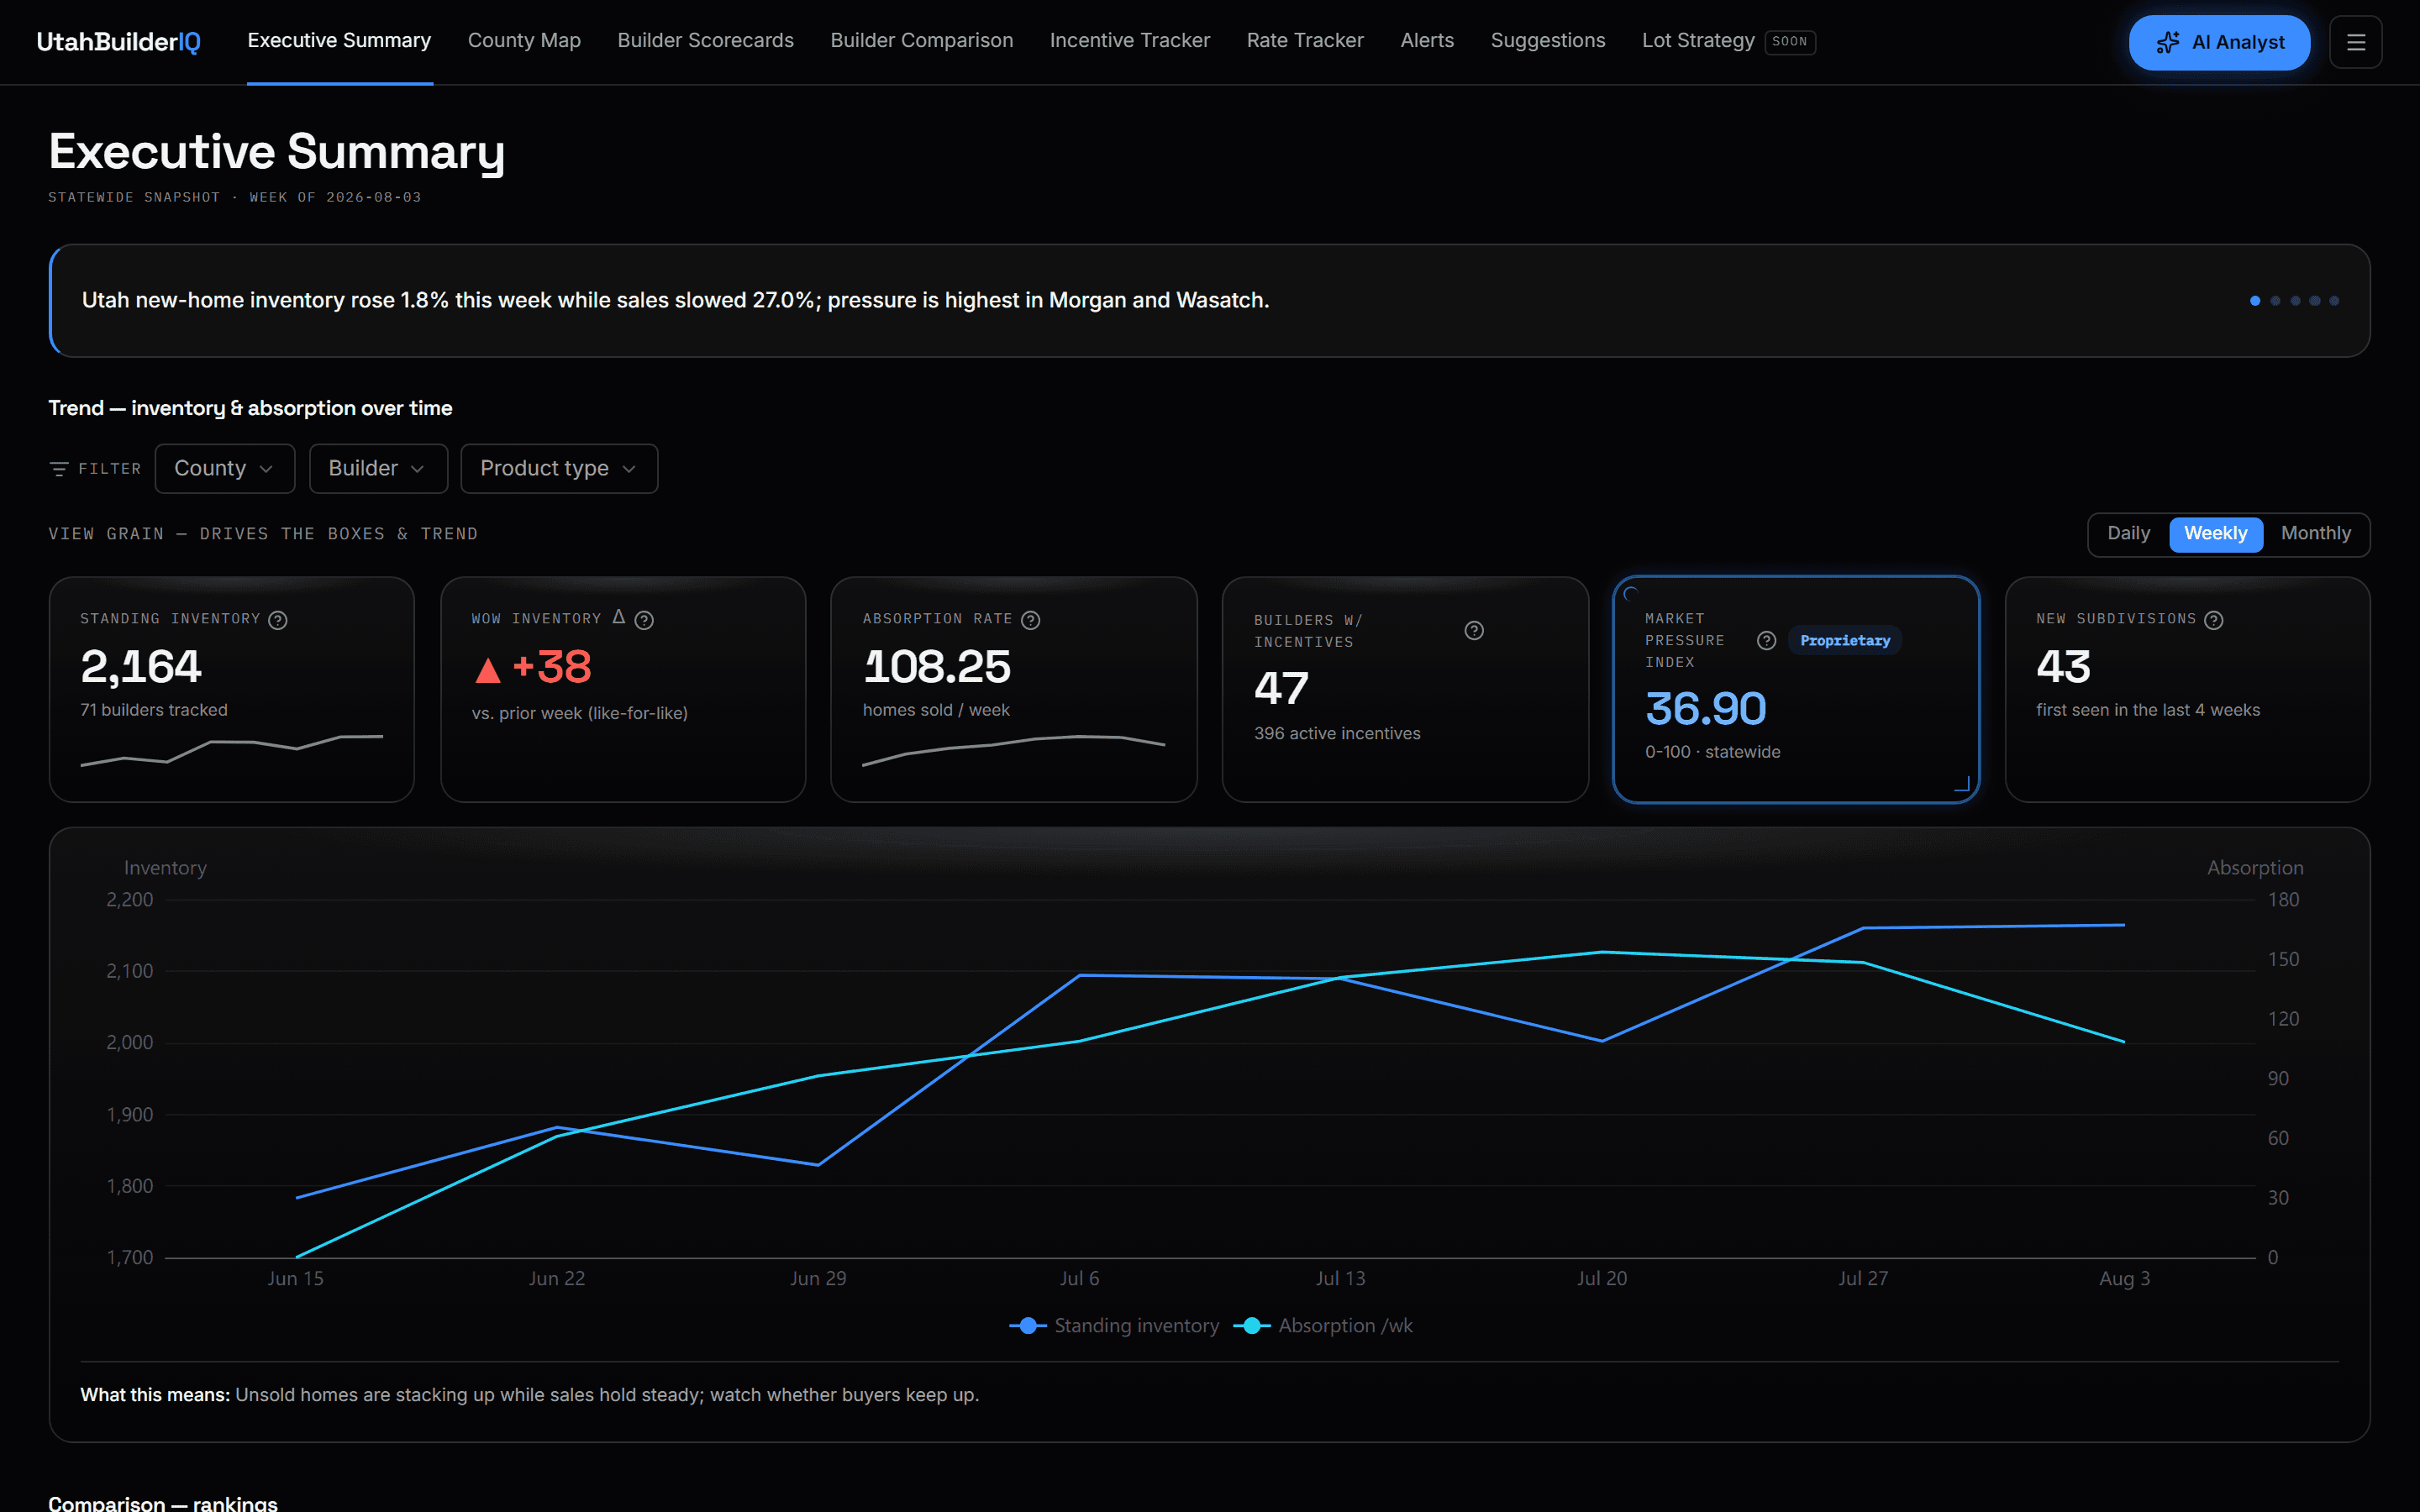
Executive Summary
The statewide read on one screen: inventory, sales pace, pressure, and incentives, refreshed daily.
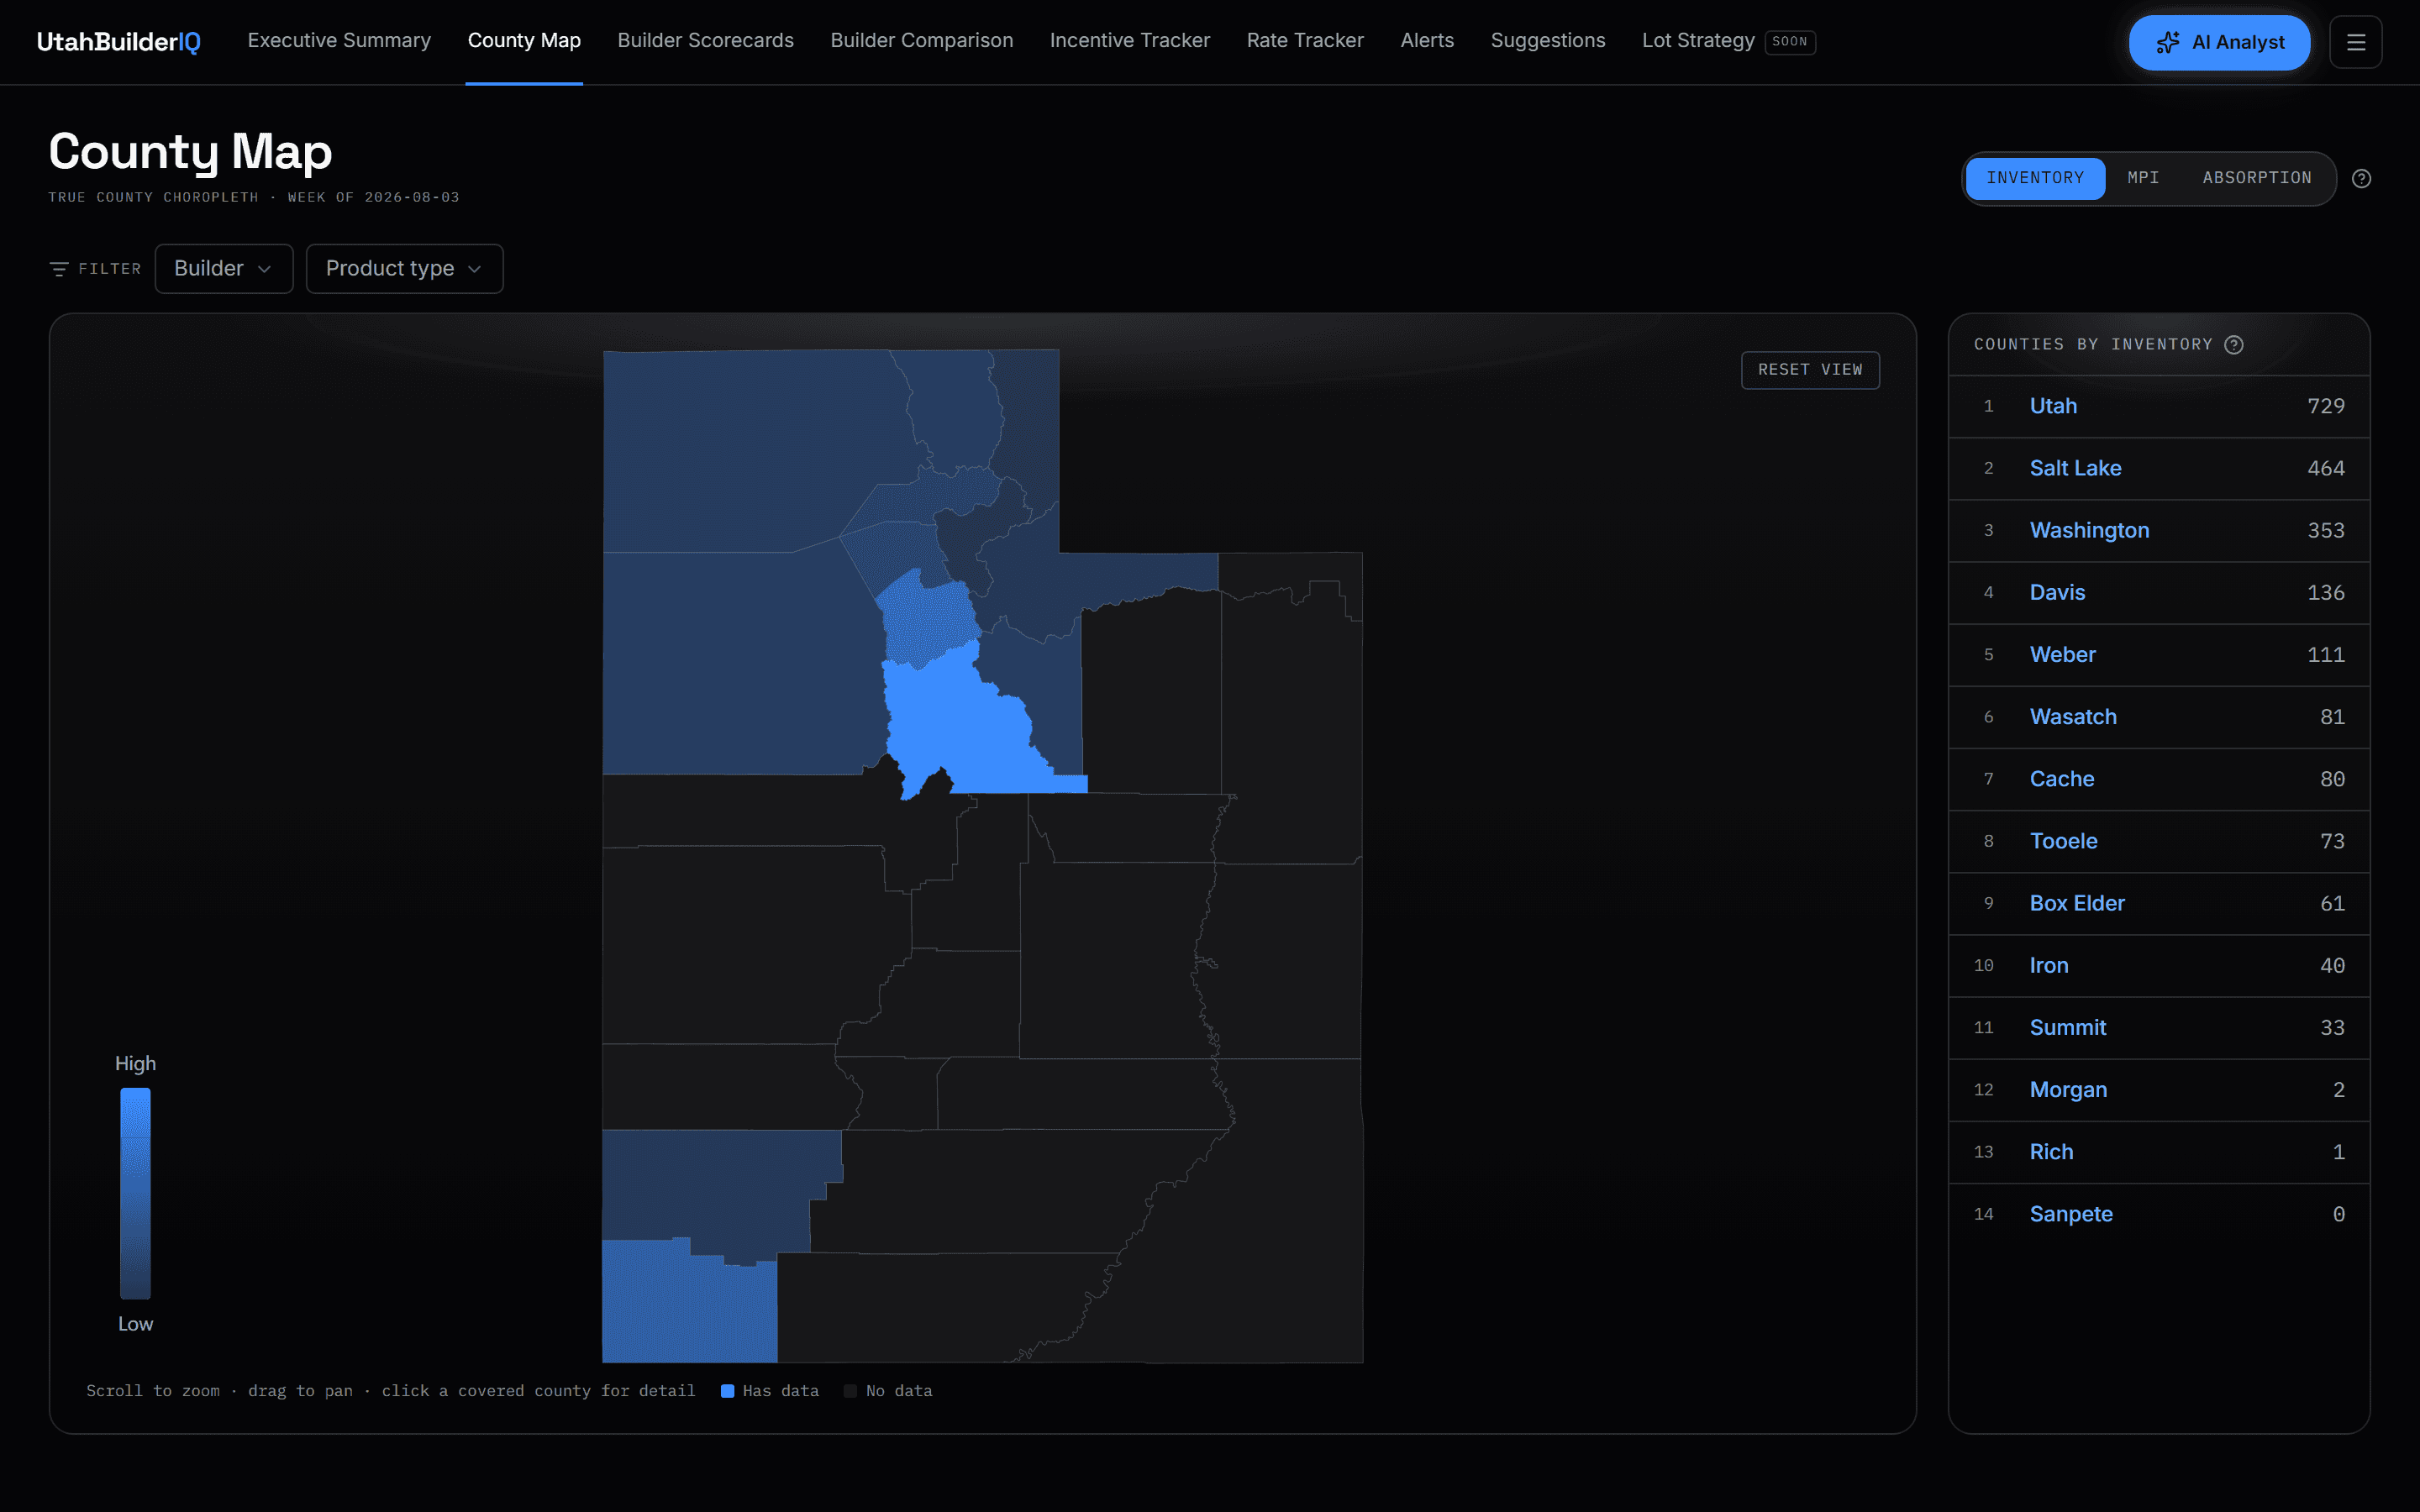
County Map
Standing inventory shaded county by county, with a ranked list and county detail one click away.
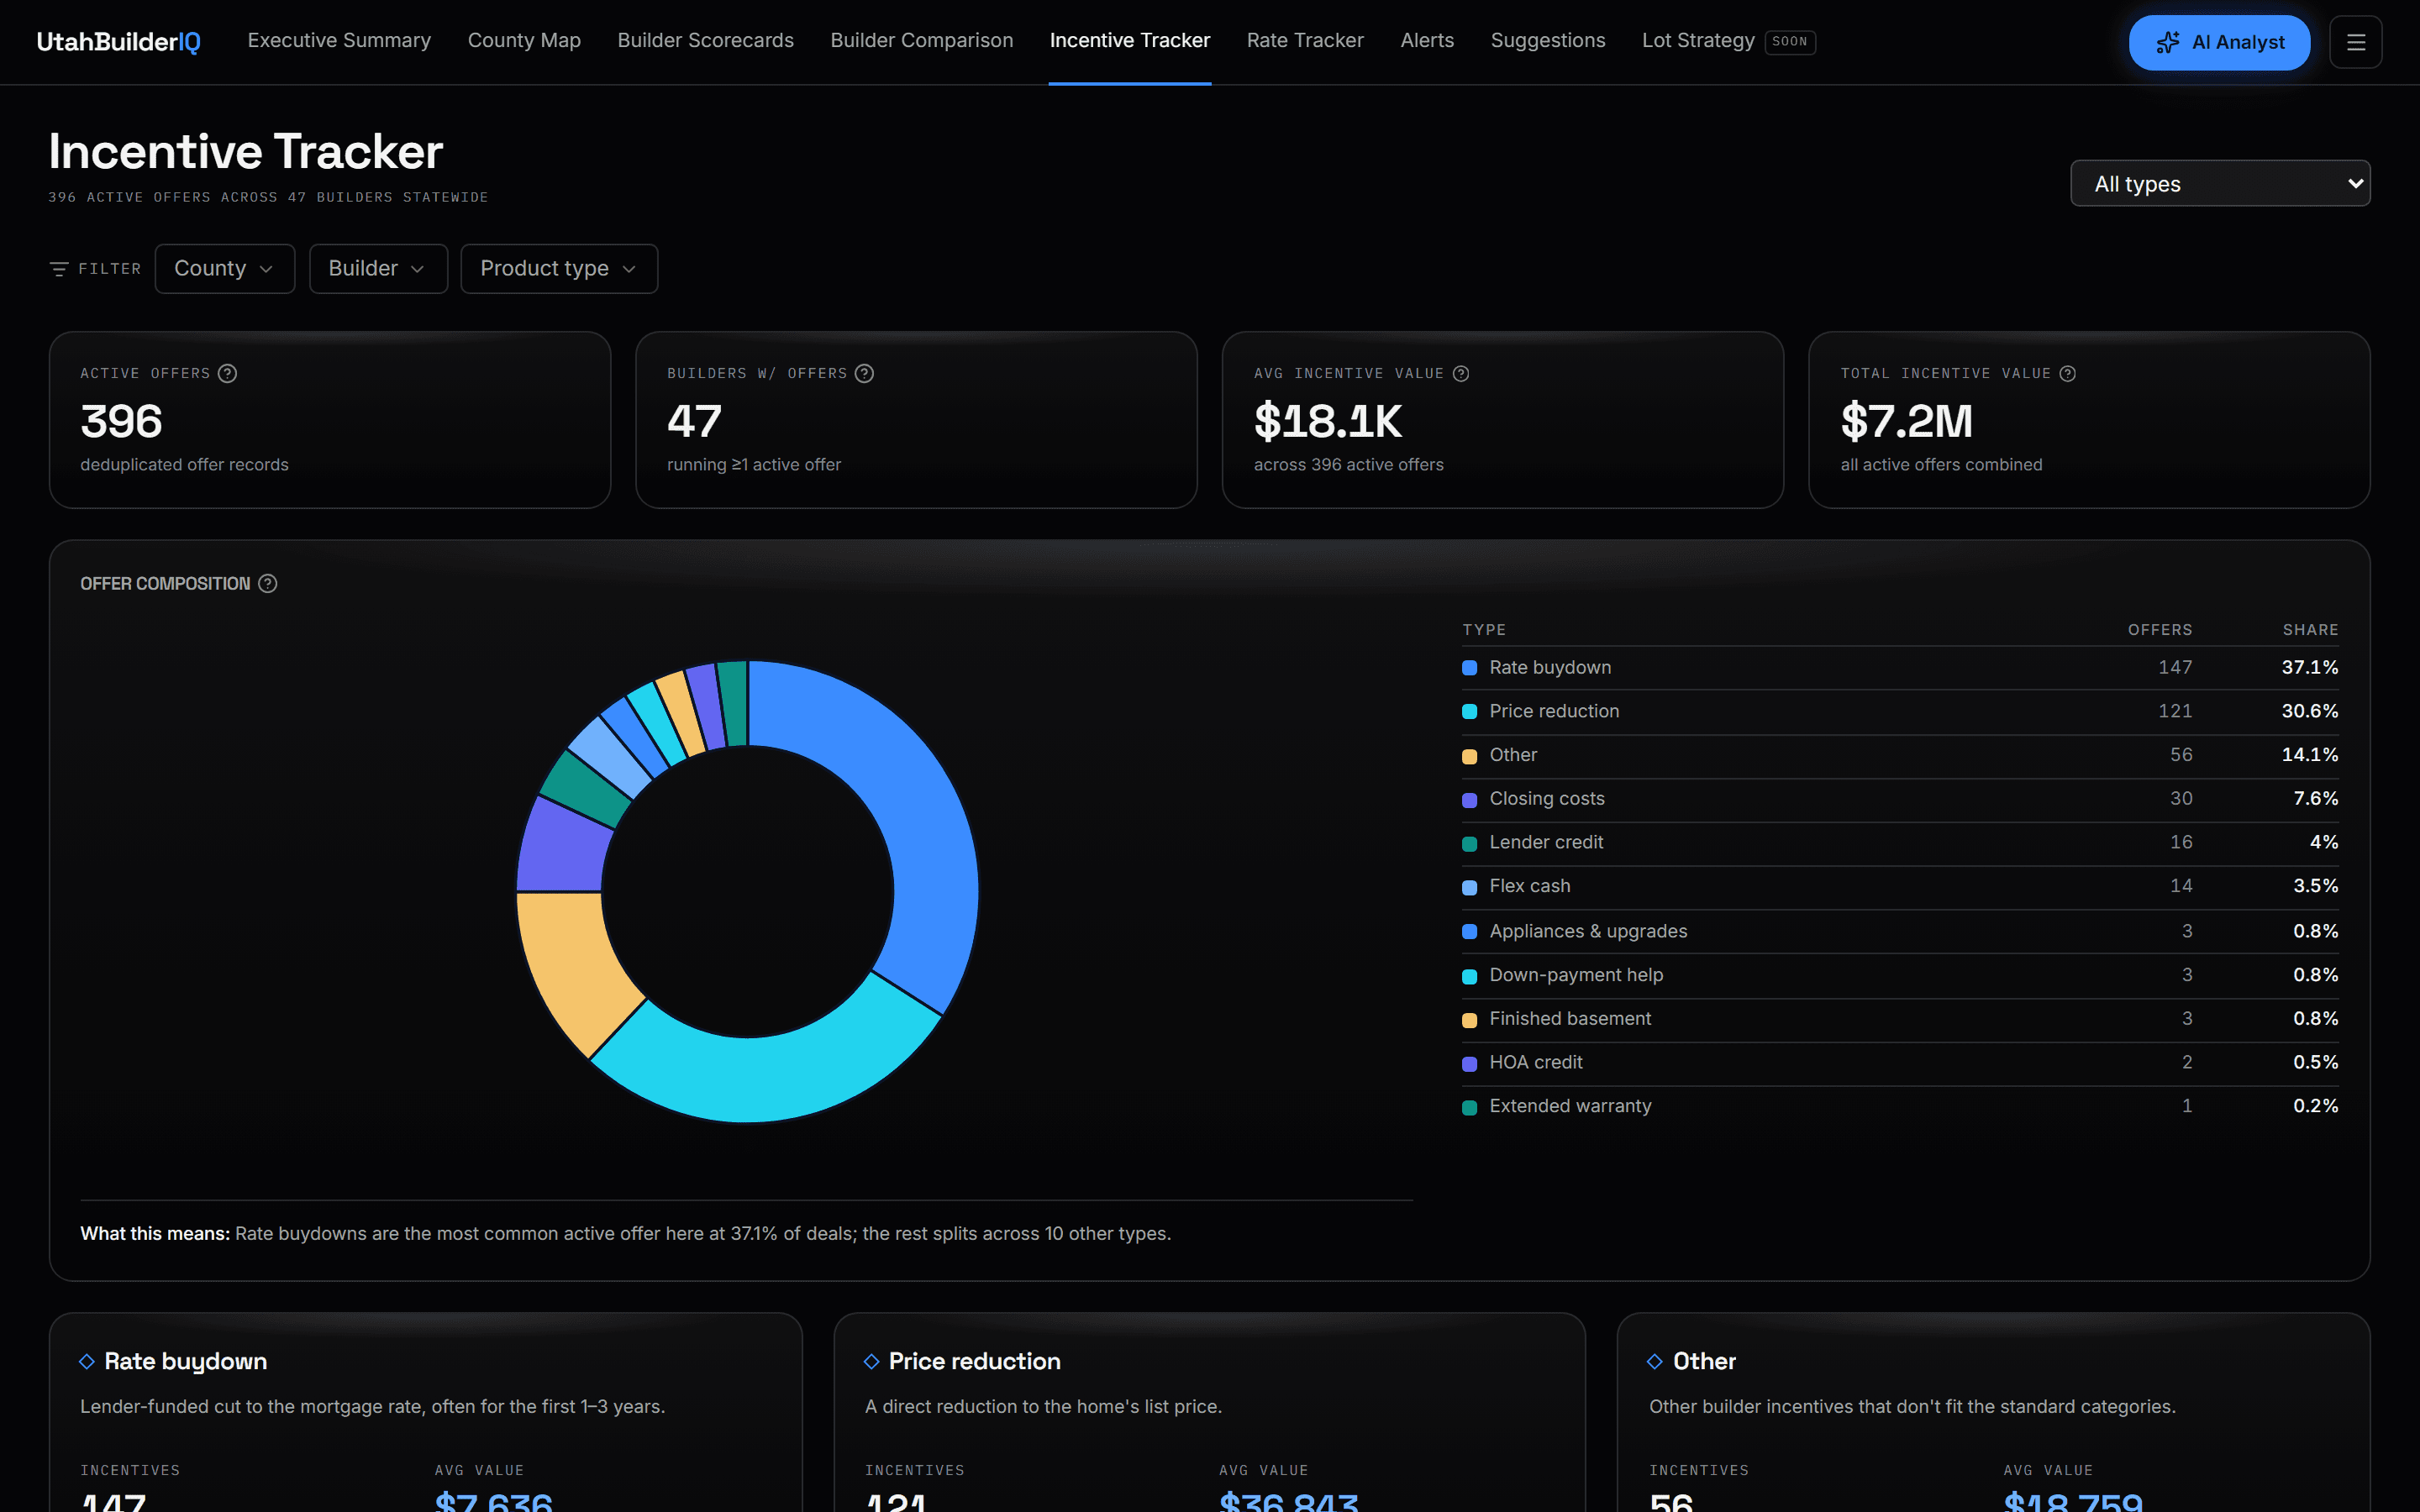
Incentive Tracker
Every advertised offer we capture, broken down by type and value across the market.
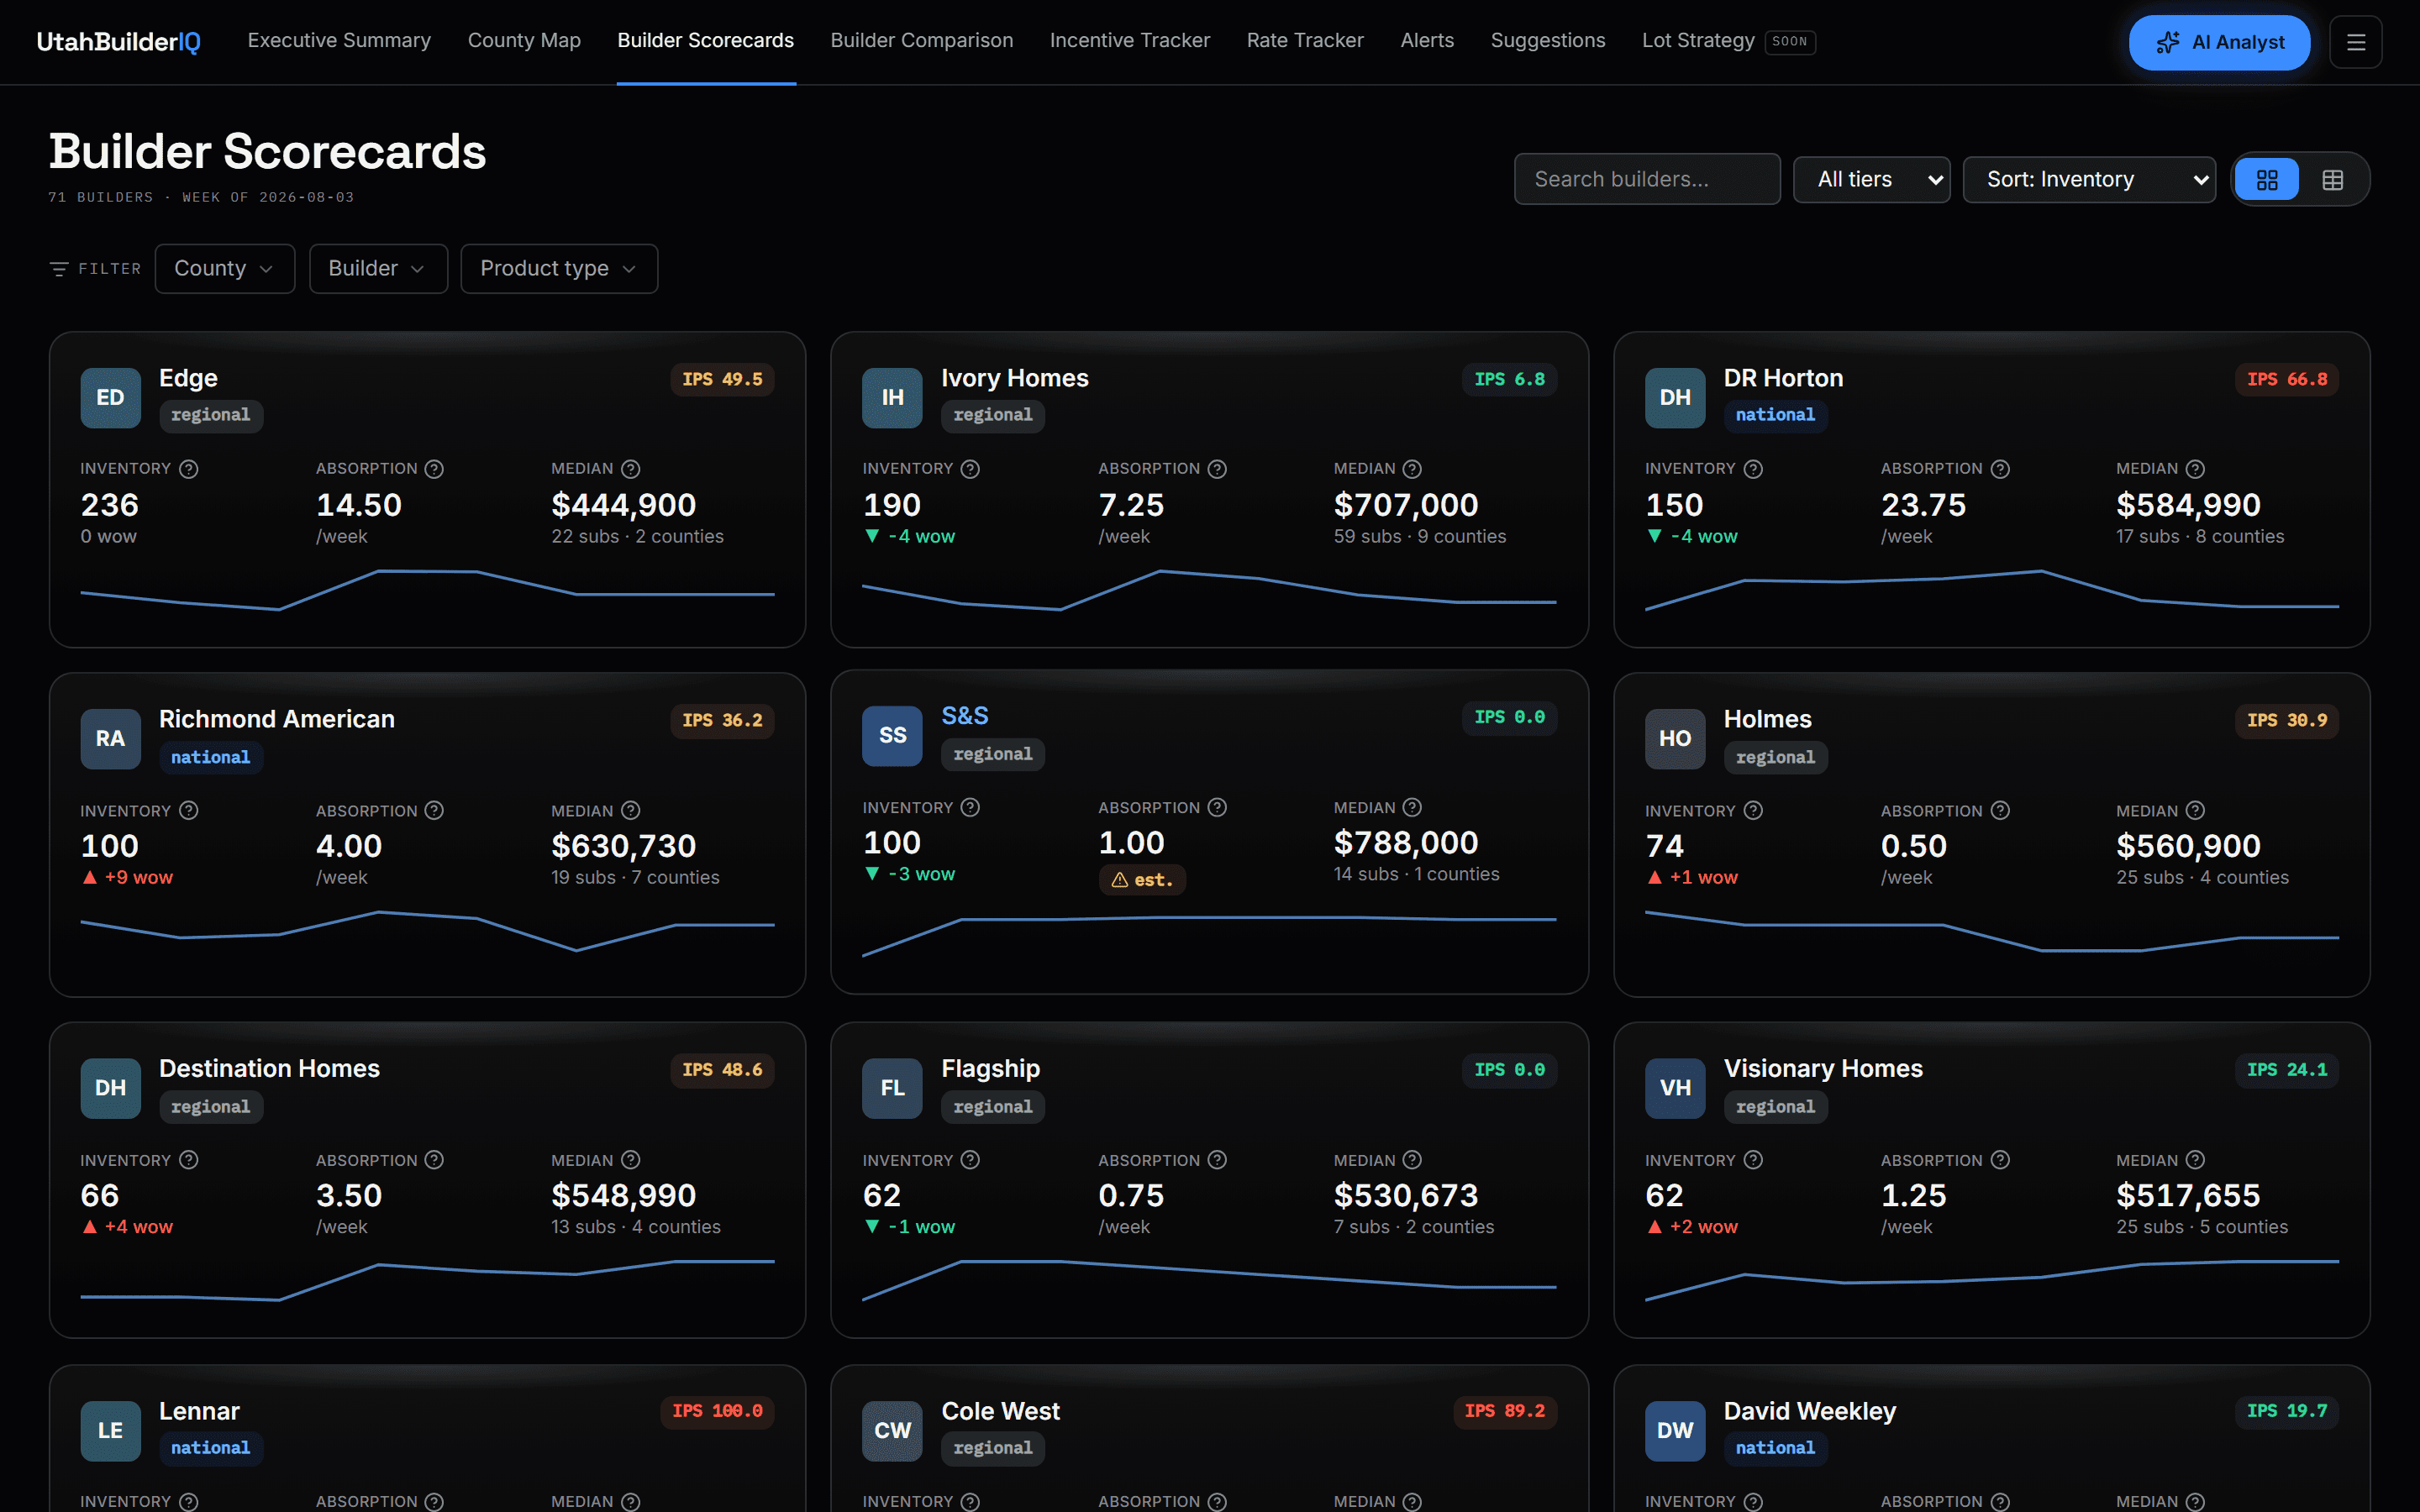
Builder Scorecards
Every builder graded on the numbers that matter: inventory, sales pace, pricing, and discounting pressure.
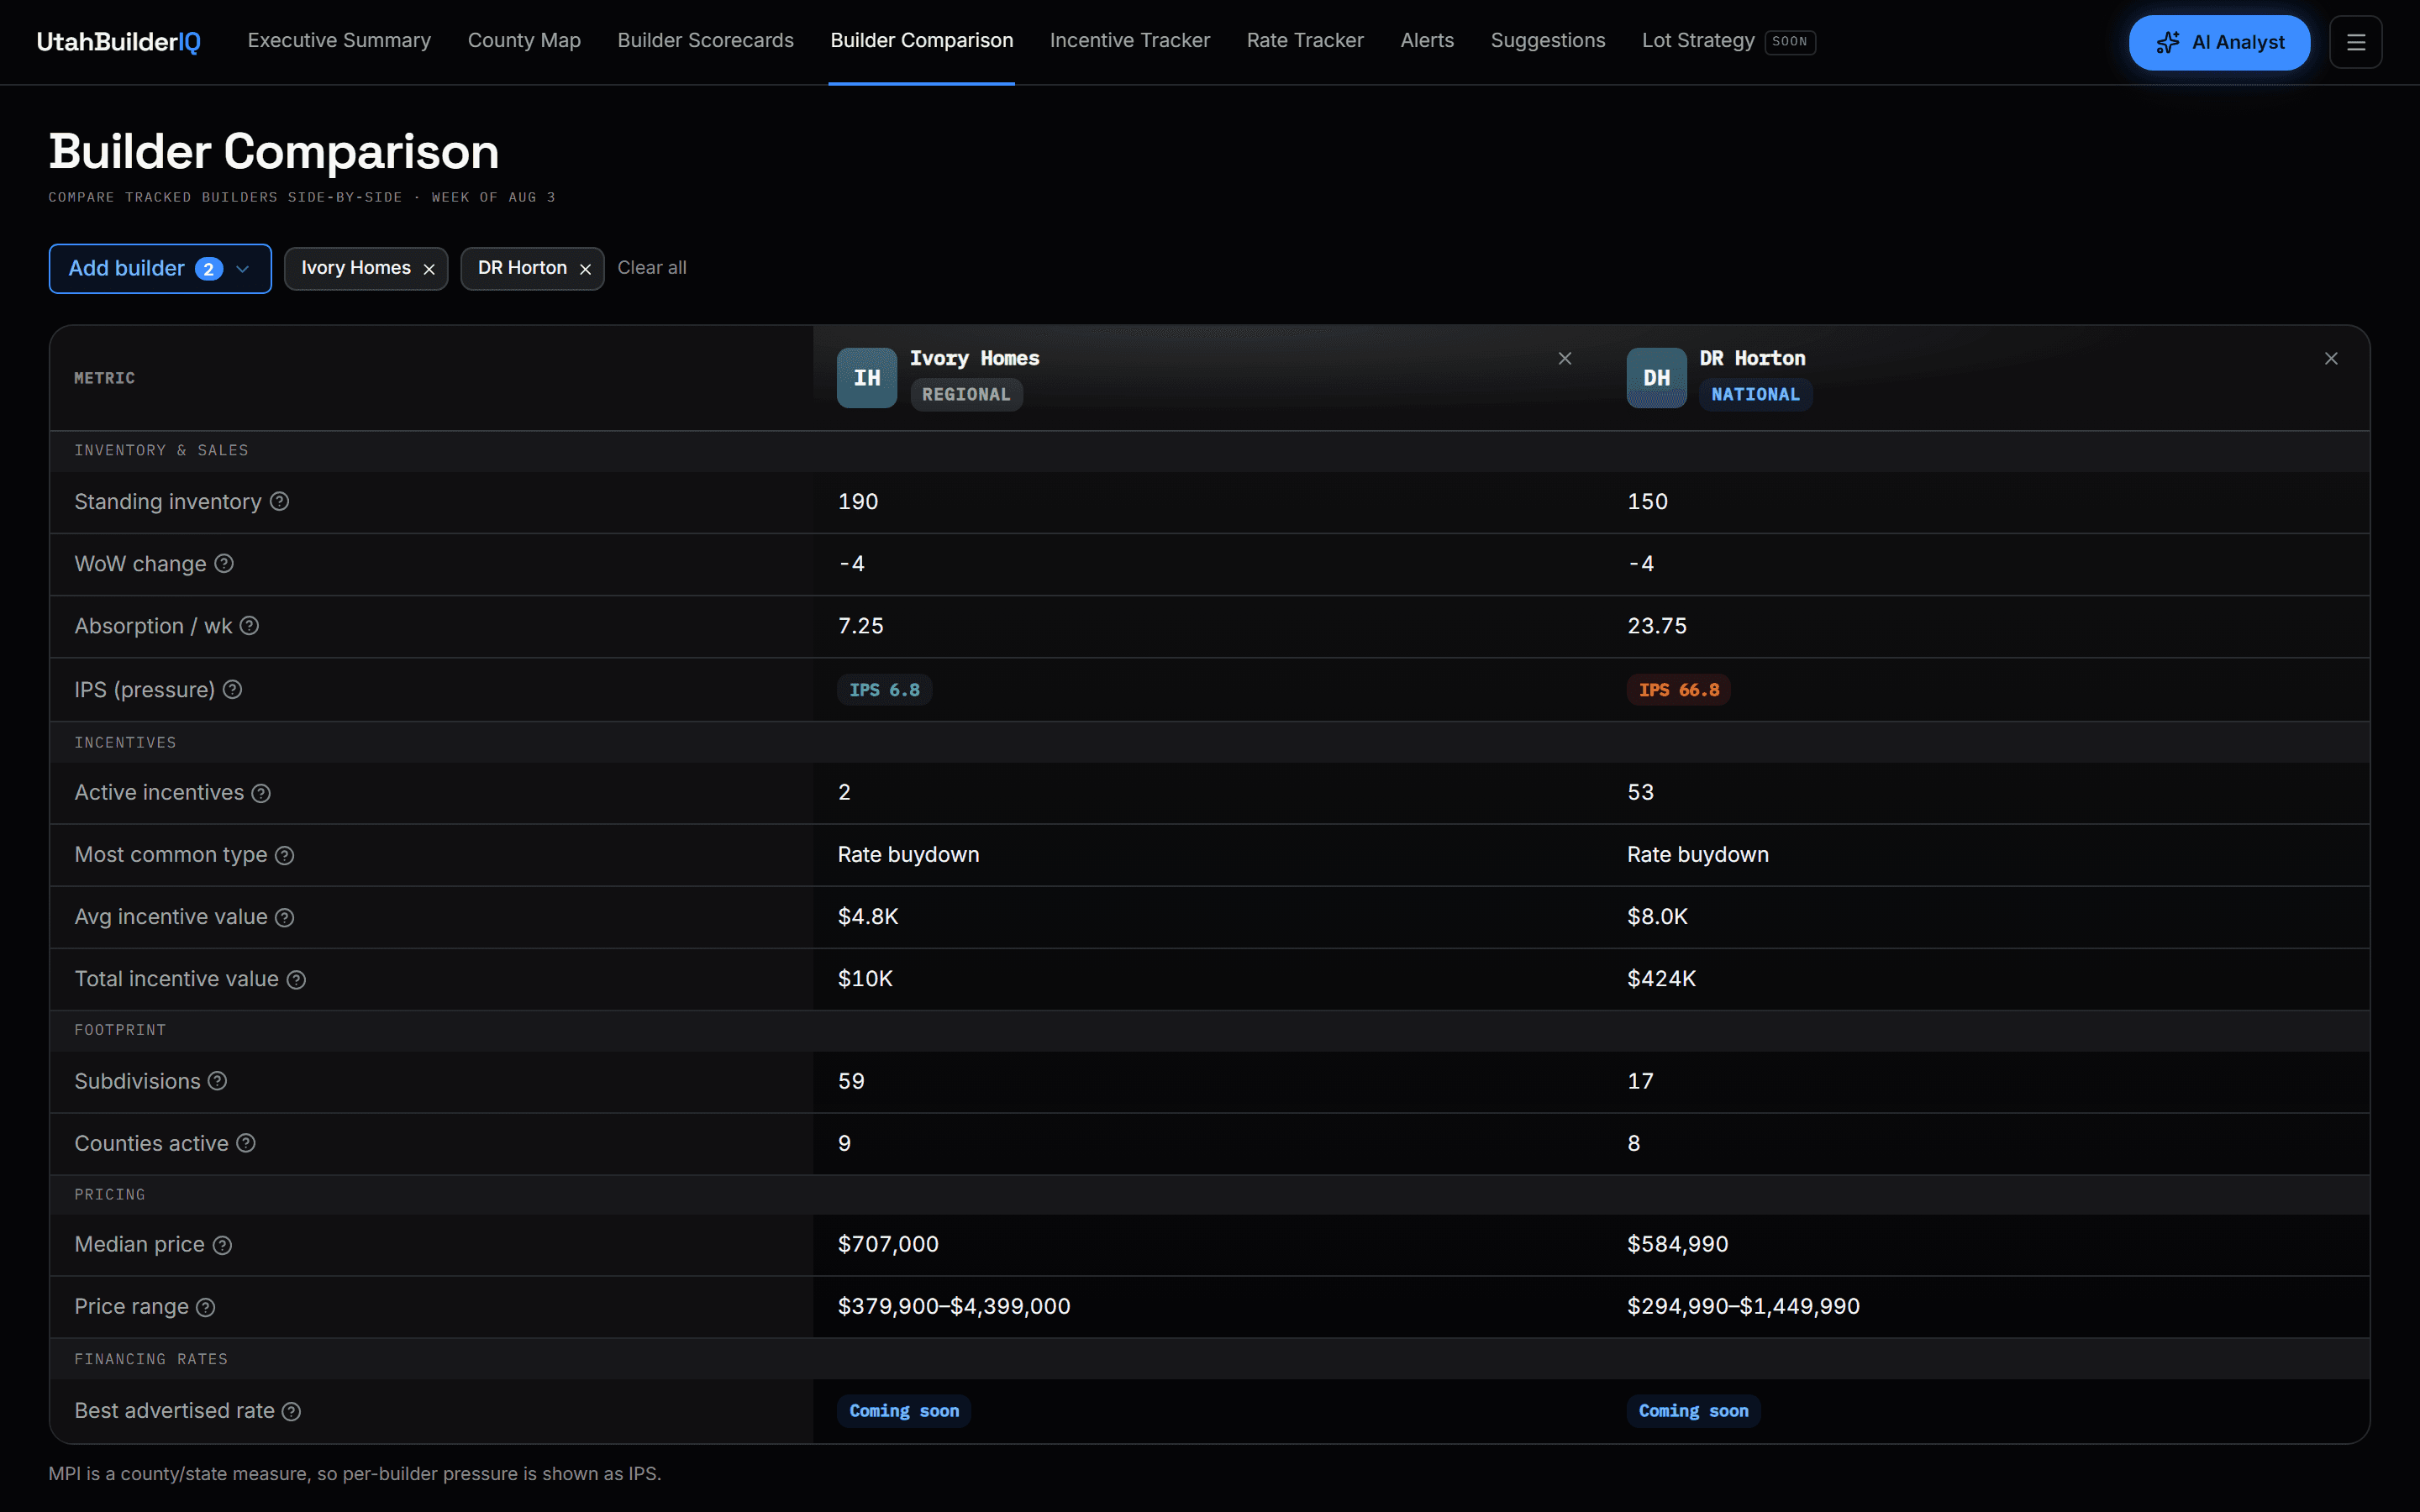
Comparison
Any two builders head to head: inventory, pace, incentives, pricing and the permits they pull, side by side.
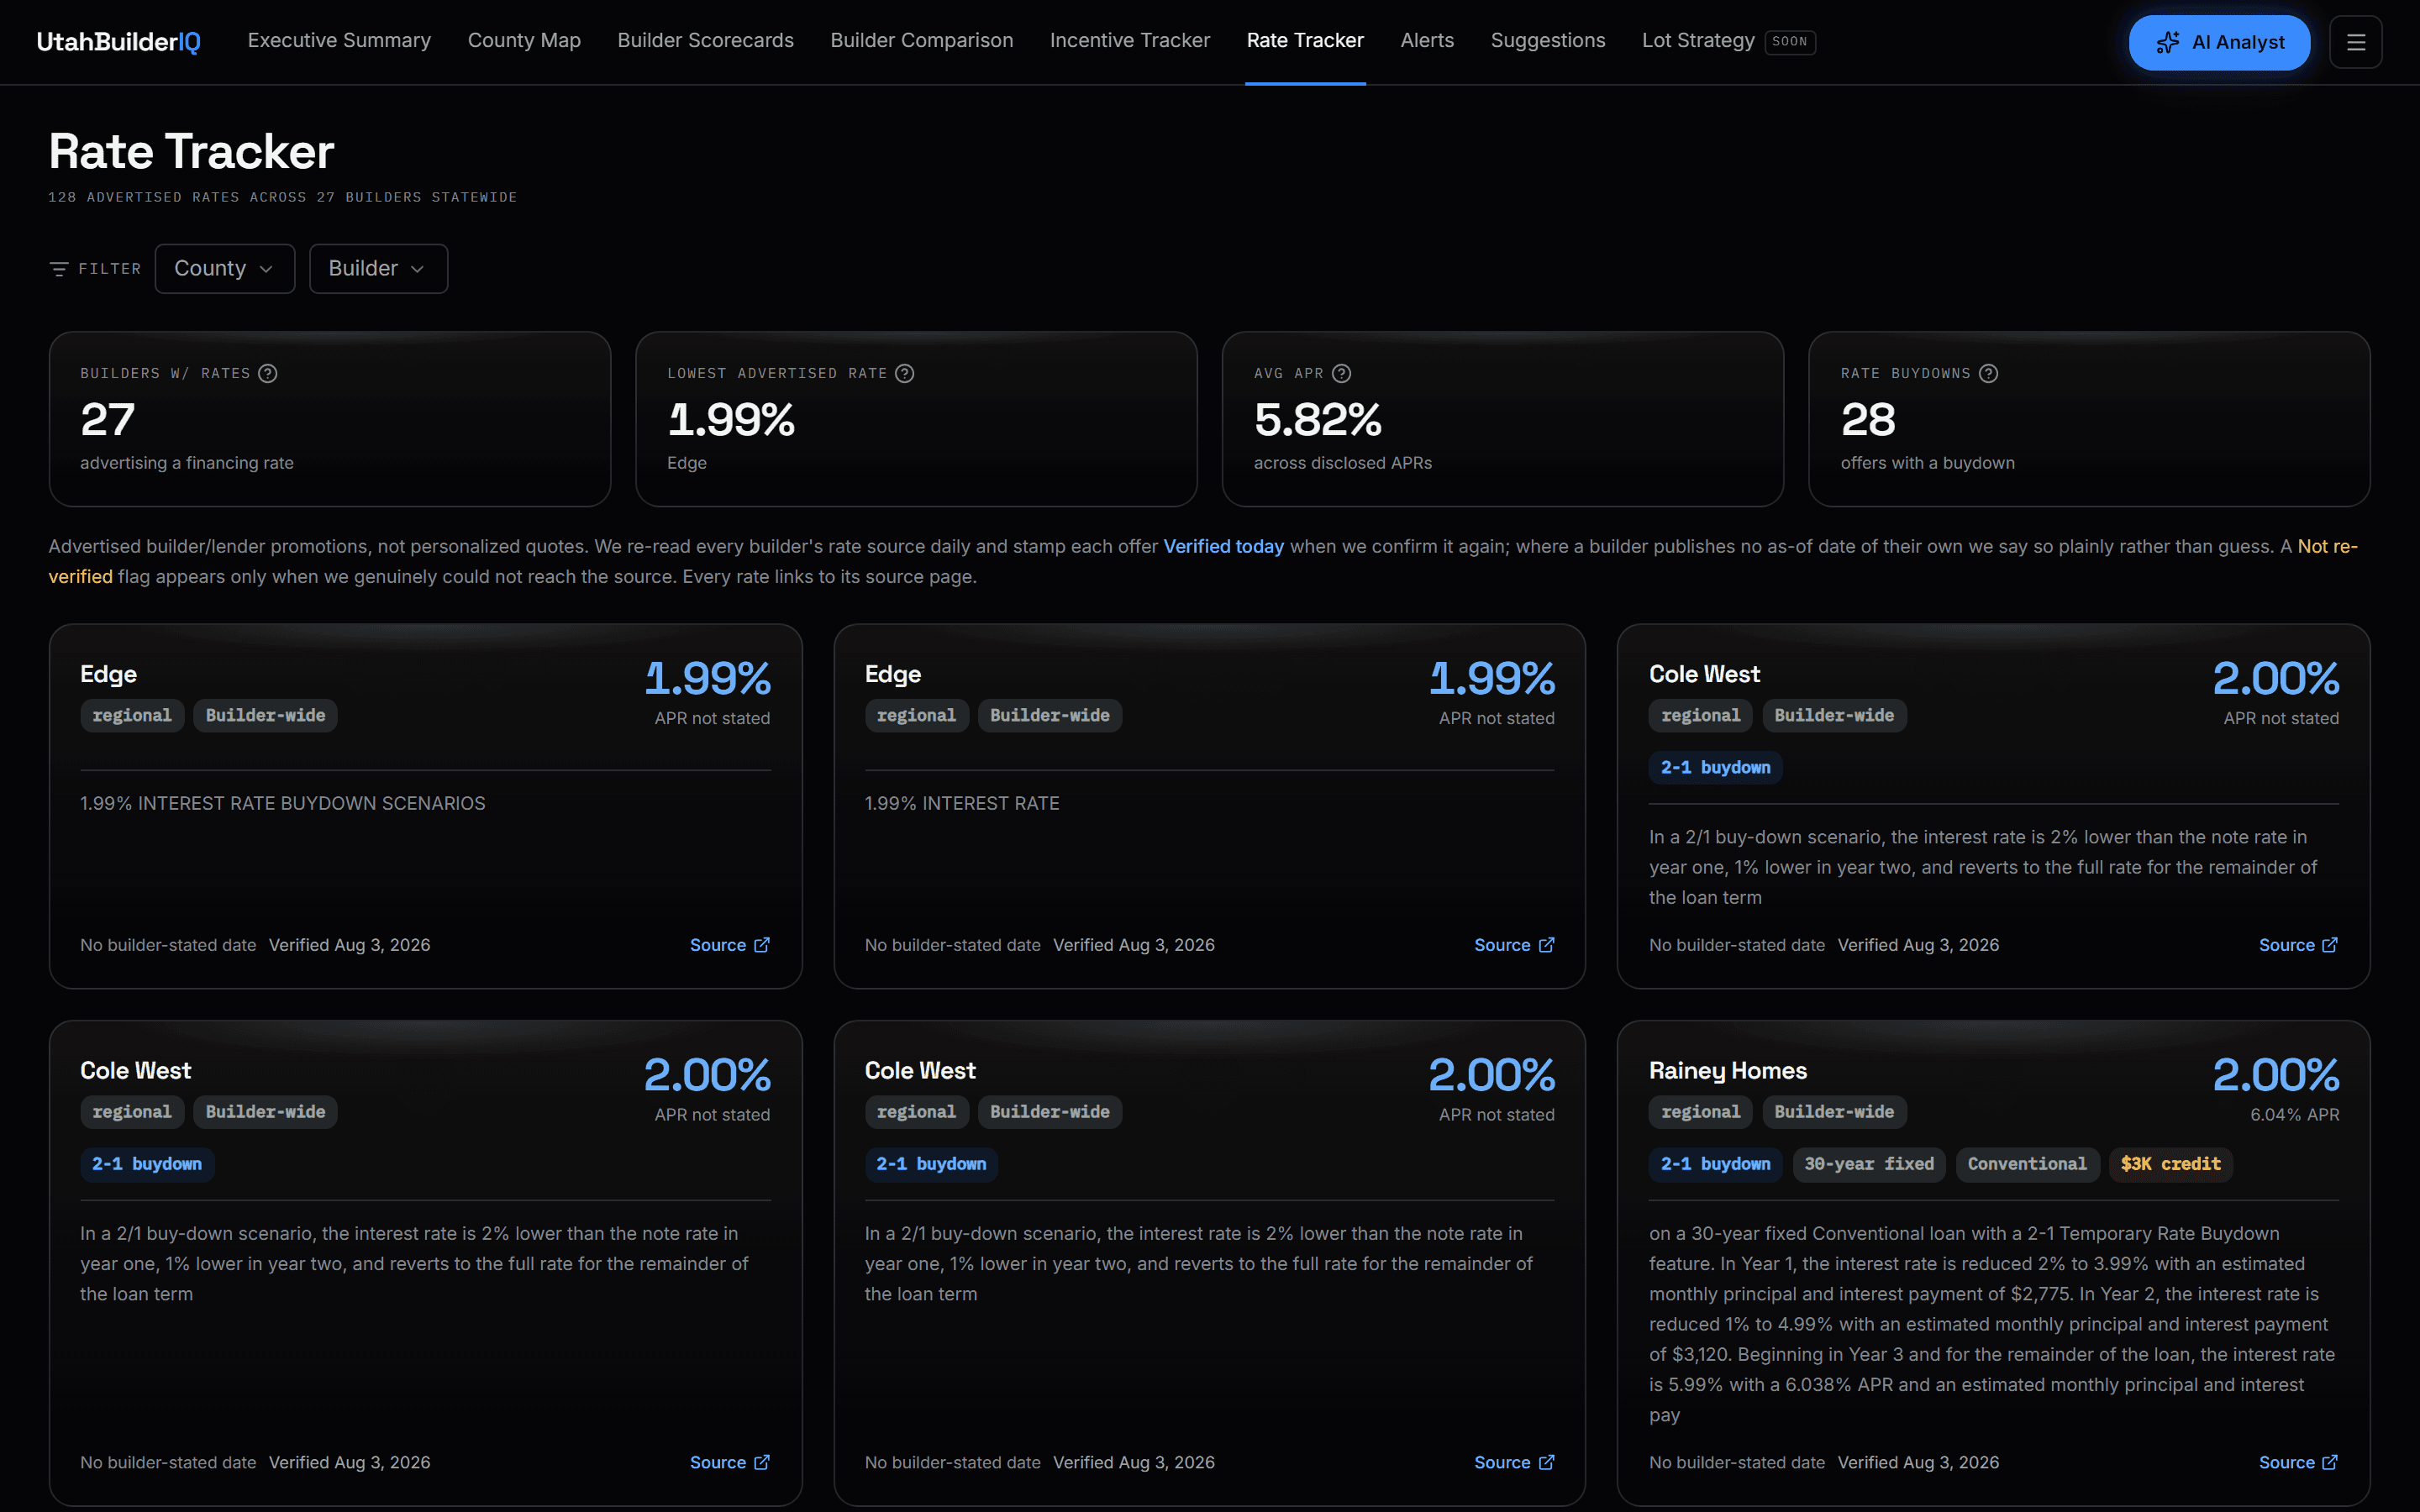
Rate Tracker
Every advertised rate and buydown, updated daily from the builders' own sites.